7 Important KPIs to Monitor in Google Analytics

Back in the day when I was new to the Google Analytics, I would often stare at reports for hours not knowing what to do.
Until I came to know about KPIs…
Google Analytics has various metrics & dimensions, so it’s very easy for anyone (new) to get lost in a sea of reports.
But once you define your business KPIs, you now have a clear goal & know which report to look at.
Monitoring the right metrics will help you save time & most importantly, achieve your business goals.
In this article, we’ll be looking at some of the important KPIs you can start monitoring in Google Analytics.
These metrics can help you answer questions like
1. Which channel is giving me more returns?
2. Are visitors engaging with my content?
3. What time does the user take to convert once he visits my website? & more.
But before that, let’s understand KPIs.
What Is a Key Performance Indicator?
According to Google, KPI is
A quantifiable measure used to evaluate the success of an organization, employee, etc. in meeting objectives for performance. In terms of web analytics,
KPIs are “metrics” which will help you monitor your specific goals.
You should then ensure that you have a firm grasp of the key metrics of your business and better reporting will certainly help with that. KPIs are a subset of metrics. So, only some metrics can be defined as KPIs. 
Let’s take a look at 7 important KPIs you need to keep an eye on…
- Goal Completions Or Revenue
- (Ecommerce Or Goal ) Conversion Rate
- Cost Per Acquisition
- Bounce Rate
- Revenue / User
- Pageviews / User
- Days To Conversion
I am assuming that the Google analytics tracking has been already setup correctly.
Let’s start:
KPI# 1 – Goal Completions Or Revenues
Well, this one might be quite obvious to you. But make sure to define 2 types of goals (examples later)
- Macro Goals
- Micro Goals
You can create up to 20 goals per view in google analytics.
To define goals, simply go to View > Goals > Click on create goals & you’ll find these 4 types:
- Destination
- Duration
- Pages / Session
- Event

If you run a lead generation site, you can define goals as
- Form Submit Leads (Macro Goal)
- Pdf/eBooks Downloads (Micro Goal)
- Link / Banner Clicks (Micro Goal)
- Session Duration > 3min (Micro Goal)
- & so on…
You can learn more about goals here.
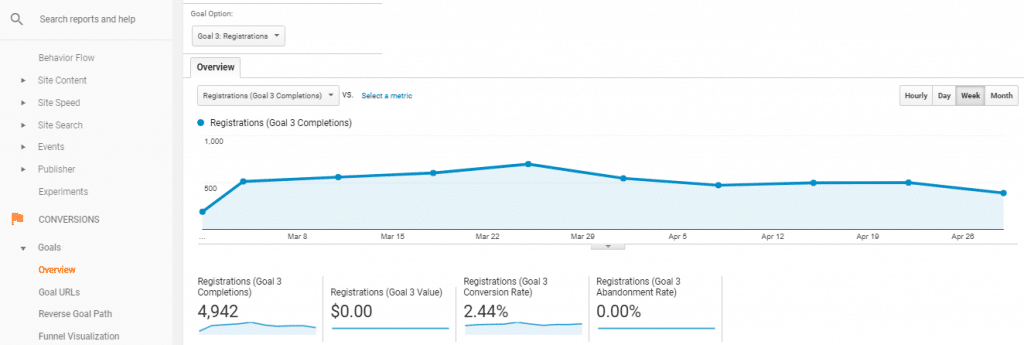
To monitor Daily/Weekly/Monthly Goals, you can go to Conversions > Overview > Select Your Goal.

If you run an ecommerce site, you should implement enhanced ecommerce tracking, so that, you’ll get the revenues in the dashboard. There are also SaaS analytics metrics that you could configure if you run a SaaS business.
The Sales performance reports will provide an extensive insight on the Daily/ Weekly/Monthly revenue.

You can get more insights by segmenting this KPI with the following dimensions.
- Source / Medium
- Device
- Day/Week/Month
- New v Returning
KPI #2 – (Ecommerce Or Goal) Conversion Rate
The conversions rate mainly depends on 2 things
1. Quality of Traffic
2. Quality of Website/Landing Page
Your KPI might suffer if you lack any one of these. So make sure to keep an eye on the conversion rate of your website.
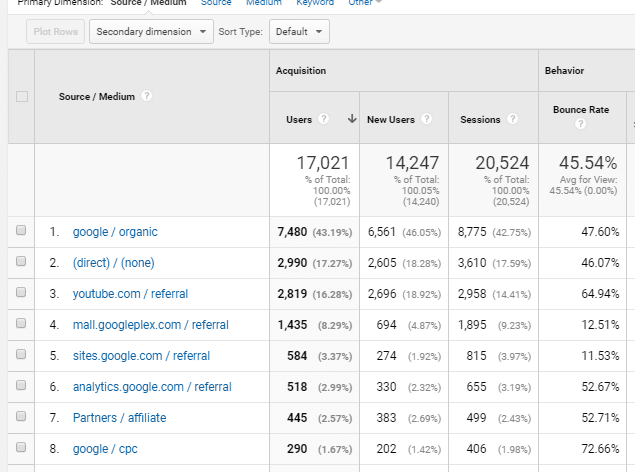
Conversions Rates are only insightful when broken down into various dimensions. Below reports shows the conversion rate across various sources.

If you run an ecommerce store, just select Revenue from the conversion dropdown.
You can even get more insights by segmenting this KPI by the following dimensions.
- Channels
- Devices
- Browser
- Landing Page
- Site Speed
- Count Of Session
Tip: Struggling with lower conversion rates? Check out these various tools to improve your conversion rate.
KPI #3 – Cost Per Acquisition
If you are a startup or have a budget constraint, then this metric can save you from over-running your budget. Monitoring this metric can also help you assign a budget to the most profitable source of relevant leads.
Here’s an example:
Let’s say, from source#1, you are getting 100 users at a cost of 500$ & 10 users end up converting. You’ll have
- CPA: 50$
- Rate: 10%
From source#2, you are getting 50 users at a cost of 500$ & 5 users end up converting
- CPA: 100$
- Rate: 10%
When you have similar conversion rates, CPAs can help you determine what’s your profitable source.
You can create a custom report in Google Analytics & add in the Cost Per Acquisition metric.
Here, I have added source/medium as a dimension & CPA as one of the metrics.

You need to integrate AdWords with analytics to get Google/CPC cost metrics. To add cost data from other 3rd party sources, check these Google docs here.
Similarly, CPAs can be broken down by
- Campaigns
- Devices
- City/State/Country
- Weekends / Weekdays
- & so on…
KPI# 4 – Bounce Rates
Bounce rate is useful in gauging the traffic or landing page quality. Assuming that your google analytics setup is correct, higher bounce rates can increase your cost per acquisition.
Higher bounce rate can be due to
- Targeting irrelevant users to your good landing page
- Targeting relevant users to your bad landing page.
You can look at the landing page report to find the pages having high bounce rates.
Here I have shown the Bounce Rates for each landing page compared to site avg.

You can also check for the traffic sources having high bounce rates.

Other dimensions you can use to segment bounce rates are
- Device
- Browser
- Screen Resolution
The bounce rate is also an important KPI metric when it comes to measuring your analytics for SEO purposes because it’s speculated that Google does look at the bounce rate of your pages when determining its stickiness and thereby its ranking position.
KPI# 5 – Revenue / User
You can create this KPI by using calculated metrics functionality in google analytics.
You can go to calculated metric in the view section > Create a new metric > Use the formula {{Revenue}} / {{Users}}.

You can use this metric in custom reports.
You can check the conversion rate KPI section for the sample report.
KPI# 6 – Pageviews / User
This is an engagement KPI & will help you to monitor the page depth per user.
If you have an e-commerce site with a variety of products it is quite important to know how many pages do user visit before making the first purchase.
This is metric is not available by default in Google Analytics. So, you’ll have to use the calculated metrics to define this new metric.
You can use the same method as described above.
KPI# 7 – Days To Conversion
This KPI will tell you how many days does the user take to complete the goal starting from the acquisition date. Usually, if you sell high-value products, the purchase cycle will be longer.
But it’s important to know the purchase cycle for your products/services.
You can check Conversions > Multi-Channel Funnels > Time Lag Reports
Select your desired goal & you’ll get the distribution of the conversions & revenue by days to conversion.

Conclusion:
Before you take decisions on these KPIs metrics, make sure to have a proper setup of Google Analytics. Many businesses have different needs at different stages of business, so define your KPIs correctly.
You can create a process to monitor these KPIs weekly, bi-monthly, monthly & so on and take actions based on the results.
Lastly, try to focus more on those KPIs which will directly impact your business bottom line.
Ritwik
Latest posts by Ritwik (see all)
- 7 Important KPIs to Monitor in Google Analytics - May 11, 2018


That’s great! Google Analytics is a free tool available to all but the way we make most of it makes the difference and you have given us major analytics goals to keep.